Clustering kmeans intro: 3 levels
3 Levels to undestand KMeans Algorithm
Here I try to introduce down a Machine Learning algorithm called KMeans which does clustering. There are mainly 3 levels in this post each progressively more detail than the previous so if you want a preview check out level 1, want to take a peek under the hood read on to level 2 and finally wants to start clustering your data with python level 3 maybe a good starting point.
Clustering as name suggest is the activity of grouping and finding themes within given things. We do it all the time, sorting emails and files into folders, stocking kitchen shelves with similar items etc. Clustering brings order and its makes things efficient.
Before we begin lets state logic behind clustering. It is to maximize the similarity of data within cluster and maximise the dissimiarity between clusters
Level 1: What’s the use case of clustering?
Here are few interesting use cases of cluseting
-
Customer Segmentation. Business want to cluster their customers so they can improve the customer experience. Think about the Netflix or Amazon recommender system, here consumers are clustered from the shopping/ viewing behaviour and recommender uses it to next recommendation. Here the clustering will bring better customer experience retaining existing consumer or convert a prospect.
-
Document Classification. With increasing amount of digital text and books an efficient way to catgegorize the those books is needed. Here clustering algorithm can help classifying using frequency of words, exisiting book tags into clusters. This increases the correct audience to reach the books efficiently.
-
Credit Card Fraud Detection. This is part of outlier detection. Here a ‘normal’ credit card usage say paying utility bills, usage at grocery stores is compared against the ‘odd’ usage like high amount transaction in overseas country may be flagged as possible fraud and trigger an authentication checks like calling the client to verify the transaction.
So these were some of the many cases business can use data to generate the clustering algorithm to make business process efficient. Here I want to point out that the interpretation of cluster is key hence involvement of domain specialist is important to give context. In many cases the cluster results may not make sense and will be useless and one should be ok to live with it.
While business use case gives some background and motivation to learn more, personally I think more day to day usage to use these technique to cluster ones data and help find patterns or themes when someone is exploring the data and understand it better especially when size of dataset is big.
Level 2: What does the KMeans Clusering do?
- User loads the dataset n datapoints and inputs K cluster size - this is where user hands over control to machine.
- Machine assigns K random points as initial cluster centres and each of the n data point is assigned to their nearest cluster centre
- For each cluster, compute the new K cluster centroid as cluster centre
- Now re-assign all the data points to the diffrent clusters by taking into account the new cluster centroids
- Keep iterating through the step 3 & 4 until there are no further changes possible
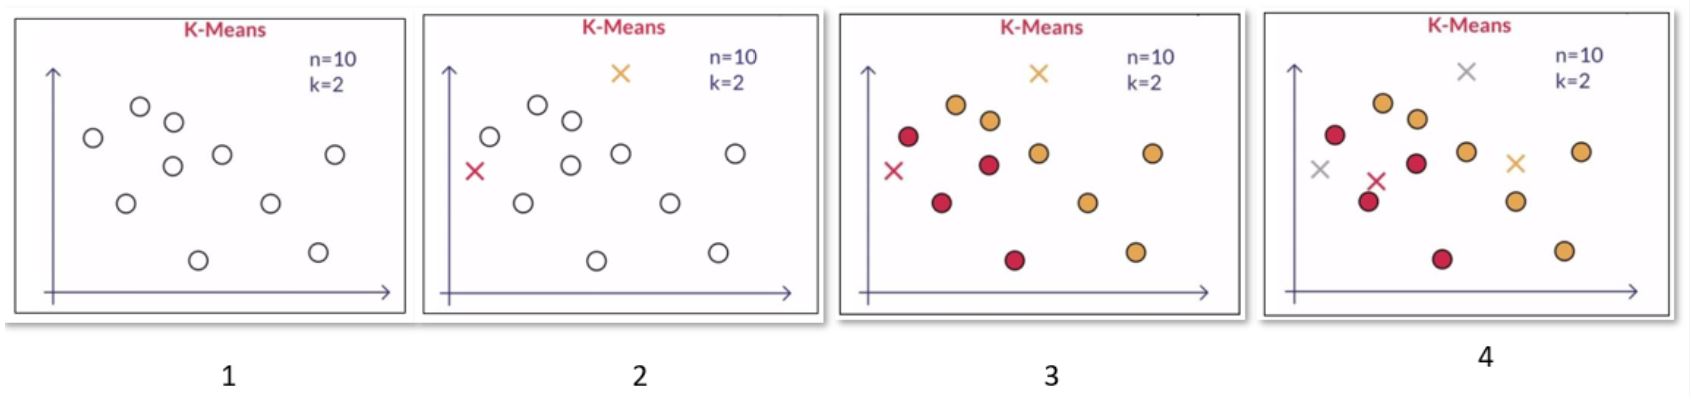
If you are wondering what centroid is think of center of gravity from high school physics. Essentially what we have done is the found clusters whose centroids are ‘Close’ (similar) to points within cluster and ‘Far’ (dissimilar) from points from points from other cluster.
On side note here the example shows a 2-D clustering problem and easy to visualize, in real world the data points can have several features i.e. n-dimensional but the algorithm works uses same logic to work.
Level 3: Clustering Starter Code in Python
Lets start by importing the relevant libararies. The one in focus is KMeans from sklearn.cluster package.
Load the data. here I have used open source California housing data from 1990 census, see kaggle link. It has data for residential housing in California of a ‘block’ with location - lat/ long, median income of household and other house characteristics.
Can we find a pattern or theme in income and where people live. Let data tells us.
So what we have here is KMeans has clustered the data and we added the cluster label back to original data, see last column. Now comes the hardest part interpreting if these labels make any sense or not. For this lets go ahead an visualize data with cluser. First lets look at the map using location vs cluster label and next will be income compared with cluster label. Is there a theme here?
On side note if you know of easy way to bring a world map in python viz please let me know.
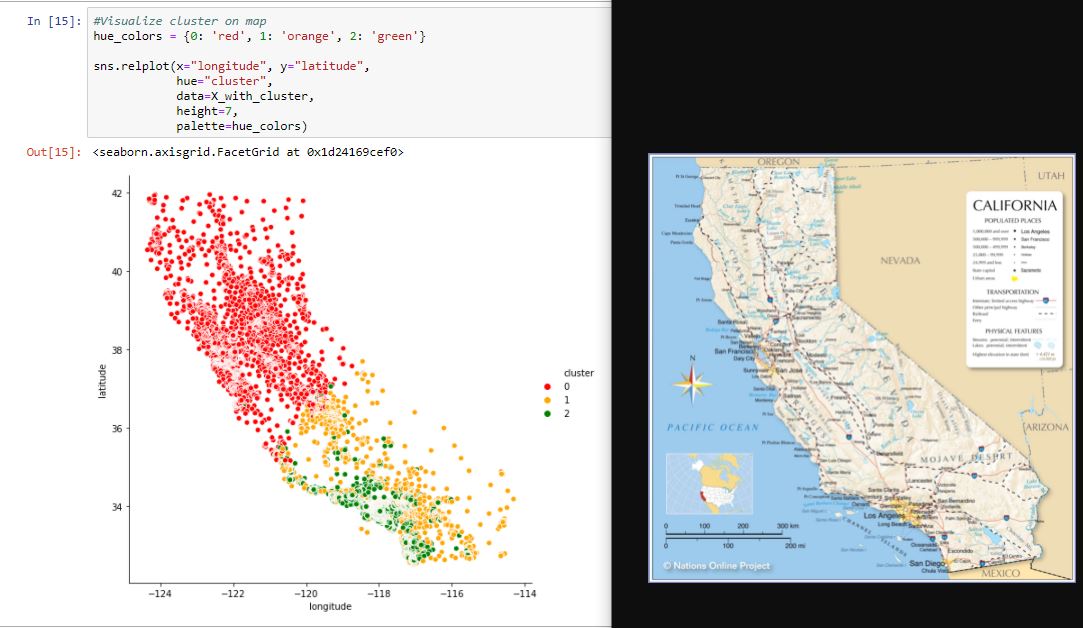
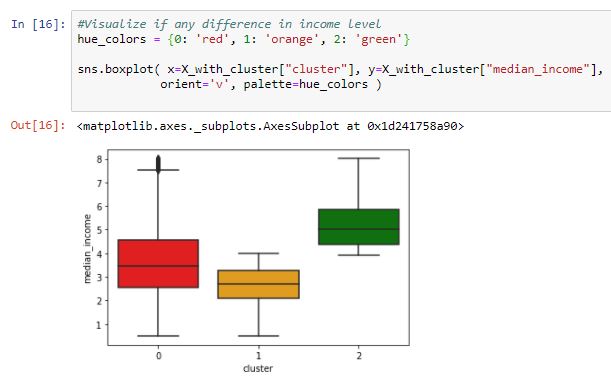
Quick look at the charts I can say the 3 cluster for 1990 California housing data are
0- People living in North California in suburbs and surrounding areas of San Fracisco. Their income is spreadout
1- Low income living in Suburb of LA and surrounding areas and some in border towns - Mexico, Nevada
2 -High income living in downtown LA (Hollywood stars?)
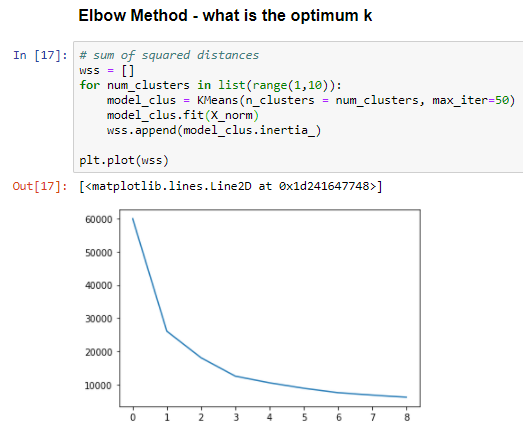
Bonus: How to decide on K i.e. number of cluster. One of the more simple guidance is called ‘Elbow Method’. Here we try out many cluster and calcluate a metric called WCSS (Within Cluster Sum of Square) - Sum of Squares of points in cluster to its own centroid. This metric drops off as K increases. Initially the rate of decrease is high and at some point the rate is slows down, that is the ‘Elbow’. K around this elbow is the most optimum. Idea is we need a tradeoff where WCSS is low enough (clusters are similar) while K is not too big so a clustering will make sense.
Here is how I figure out K=3 maybe optimum for our data set